



Best Suburban Cook County Elementaries and Junior Highs
| Grades | Enrollment | IAR English attainment % | IAR math attainment % | Chronic absenteeism % | |||
|---|---|---|---|---|---|---|---|
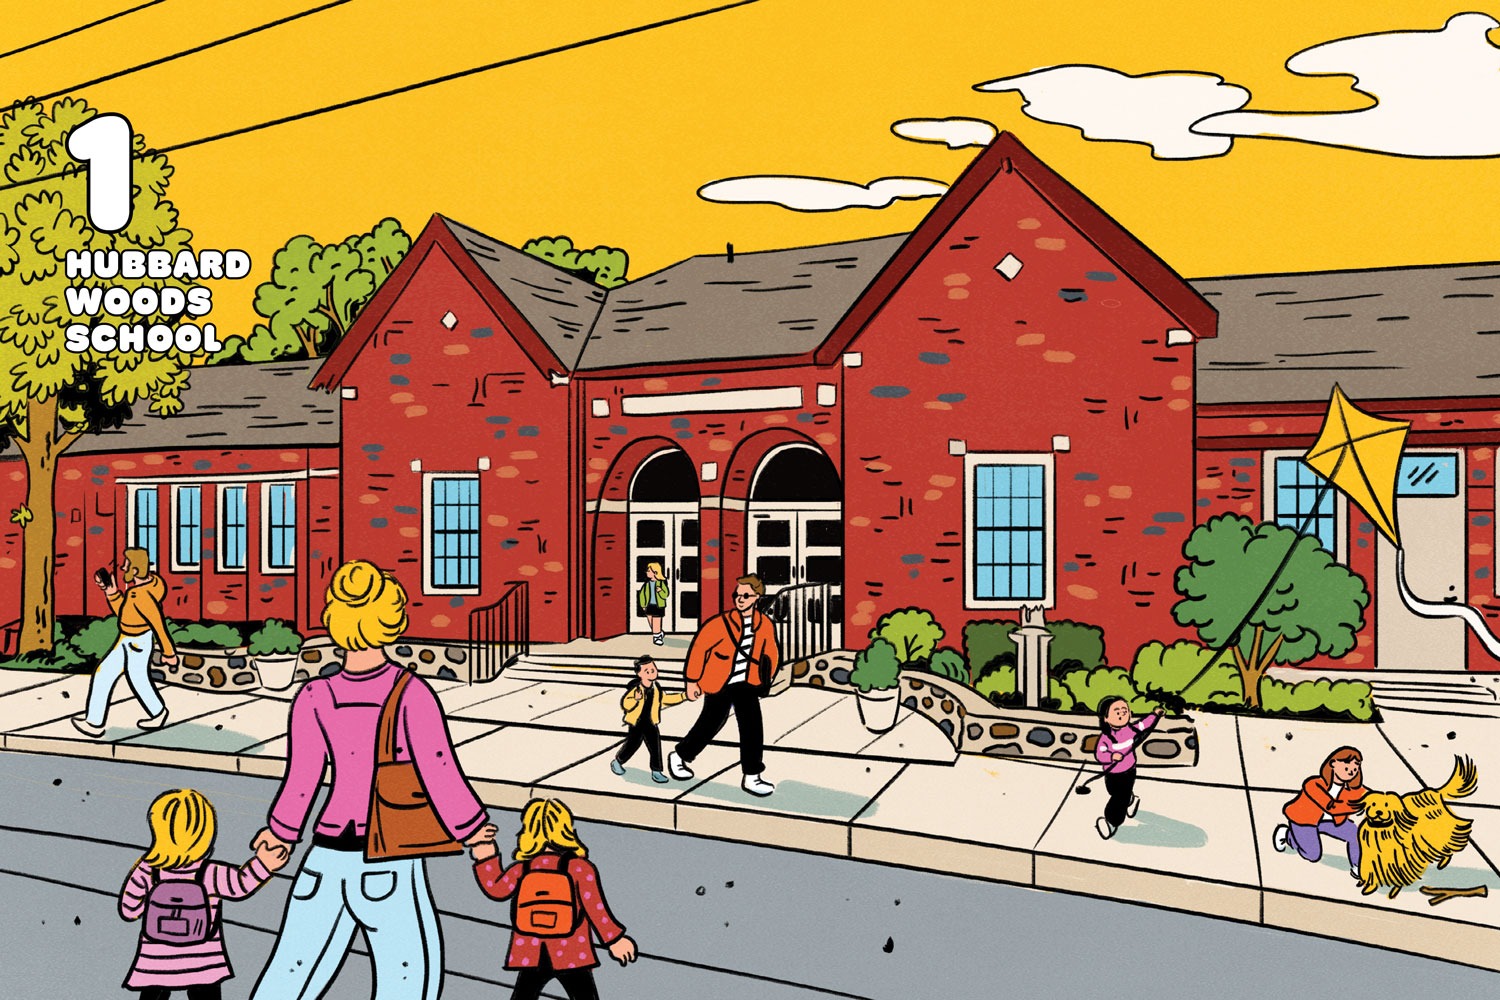
| 1 | Hubbard Woods School | Winnetka |
Has its own TV studio, where third and fourth graders produce daily news shows.
K–4
| 335 | 75 | 73 | 4 |
| 2 | Ivy Hill Elementary School | Arlington Heights | PK–5 | 534 | 64 | 58 | 13 |
| 3 | Seventh Avenue School | La Grange | K–6 | 187 | 83 | 68 | 7 |
| 4 | Maple School | Northbrook | 6–8 | 429 | 88 | 83 | 10 |
| 5 | Lincoln Elementary School | River Forest | PK–4 | 360 | 82 | 74 | 6 |
| 6 | Sunset Ridge School | Northfield |
Spends more per pupil than all but two other elementary schools in the county.
4-8
| 250 | 88 | 77 | 7 |
| 7 | McKenzie Elementary School | Wilmette | K–4 | 455 | 73 | 65 | 4 |
| 8 | Conrady Junior High School | Hickory Hills | 6–8 | 1,001 | 86 | 68 | 8 |
| 9 | Glen Oaks Elementary School | Hickory Hills | 2–5 | 638 | 76 | 66 | 10 |
| 10 | Central Elementary School | Wilmette | K–4 | 445 | 69 | 68 | 2 |
| 11 | Arnett C. Lines Elementary School | Barrington | K–5 | 505 | 73 | 63 | 8 |
| 12 | Crow Island School | Winnetka | K–4 | 318 | 68 | 78 | 7 |
| 13 | Field Park Elementary | Western Springs | K–5 | 274 | 68 | 77 | N/A |
| 14 | Blythe Park Elementary | Riverside | PK–5 | 210 | 73 | 59 | 7 |
| 15 | Spring Avenue Elementary | La Grange | K–6 | 315 | 75 | 68 | 5 |
| 16 | Pleasantdale Elementary School | La Grange | PK–4 | 470 | 67 | 69 | 12 |
| 17 | Westmoor School | Northbrook | PK–5 | 401 | 81 | 79 | 6 |
| 18 | Romona Elementary School | Wilmette | PK–4 | 496 | 74 | 70 | 6 |
| 19 | Shabonee School | Northbrook | 3–5 | 432 | 78 | 69 | 8 |
| 20 | Glen Grove School | Glenview | 3–5 | 427 | 71 | 63 | 7 |
| 21 | Harper Elementary School | Wilmette | K–4 | 360 | 76 | 60 | N/A |
| 22 | Avoca West | Glenview | K–5 | 352 | 70 | 65 | 11 |
| 23 | Roosevelt Middle School | River Forest | 5–8 | 632 | 78 | 67 | 11 |
| 24 | Palos East Elementary School | Palos Heights | K–5 | 704 | 65 | 54 | 11 |
| 25 | Meadowbrook School | Northbrook | K–5 | 452 | 74 | 83 | 10 |
| 26 | Orrington Elementary School | Evanston |
More than 30 languages are spoken by the students and staff.
K–5
| 245 | 59 | 55 | 11 |
| 27 | Willowbrook School | Glenview | PK–5 | 325 | 69 | 77 | 4 |
| 28 | Willard Elementary School | River Forest | PK–4 | 346 | 66 | 61 | 9 |
| 29 | Greenbriar School | Northbrook | K–5 | 345 | 78 | 68 | 8 |
| 30 | Northbrook Junior High School | Northbrook | 6–8 | 644 | 83 | 72 | 12 |
| 31 | Greenbrier Elementary School | Arlington Heights | PK–5 | 392 | 67 | 59 | 13 |
| 32 | Patton Elementary School | Arlington Heights | K–5 | 381 | 64 | 63 | 9 |
| 33 | Lions Park Elementary School | Mount Prospect | 2–5 | 483 | 62 | 50 | 10 |
| 34 | Wescott School | Northbrook | K–5 | 485 | 79 | 83 | 7 |
| 35 | Wood Oaks Junior High School | Northbrook | 6–8 | 445 | 85 | 77 | 12 |
| 36 | Ogden Avenue School | La Grange | K–6 | 576 | 72 | 59 | 3 |
| 37 | Old Quarry Middle School | Lemont | 6–8 | 826 | 76 | 56 | 10 |
| 38 | Forest Elementary School | Des Plaines |
An onsite early learning center has a program for children from birth to age 3.
PK–5
| 645 | 66 | 48 | 13 |
| 39 | Highlands Elementary School | La Grange | PK–4 | 563 | 73 | 73 | 6 |
| 40 | Marie Murphy School | Wilmette | PK, 6–8 | 262 | 82 | 66 | 11 |
| 41 | Central Elementary School | Riverside | PK–5 | 360 | 70 | 69 | 14 |
| 42 | Skokie School | Winnetka | 5–6 | 363 | 75 | 68 | 10 |
| 43 | Oak Ridge School | Palos Hills | 2–5 | 752 | 67 | 61 | 14 |
| 44 | West School | Glencoe | 3–4 | 248 | 67 | 70 | 8 |
| 45 | Field Elementary School | Park Ridge | K–5 | 628 | 65 | 59 | 9 |
| 46 | Joseph Sears School | Kenilworth | PK–8 | 482 | 75 | 67 | 6 |
| 47 | Central School | Glencoe | 5–8 | 578 | 77 | 76 | 13 |
| 48 | Palos South Middle School | Palos Park | 6–8 | 691 | 86 | 53 | 16 |
| 49 | A.F. Ames Elementary School | Riverside | PK–5 | 458 | 75 | 69 | 8 |
| 50 | Forest Hills Elementary School | Western Springs | PK–5 | 300 | 75 | 61 | 6 |
Best DuPage County Elementaries and Junior Highs
| Grades | Enrollment | IAR English attainment % | IAR math attainment % | Chronic absenteeism % | |||
|---|---|---|---|---|---|---|---|
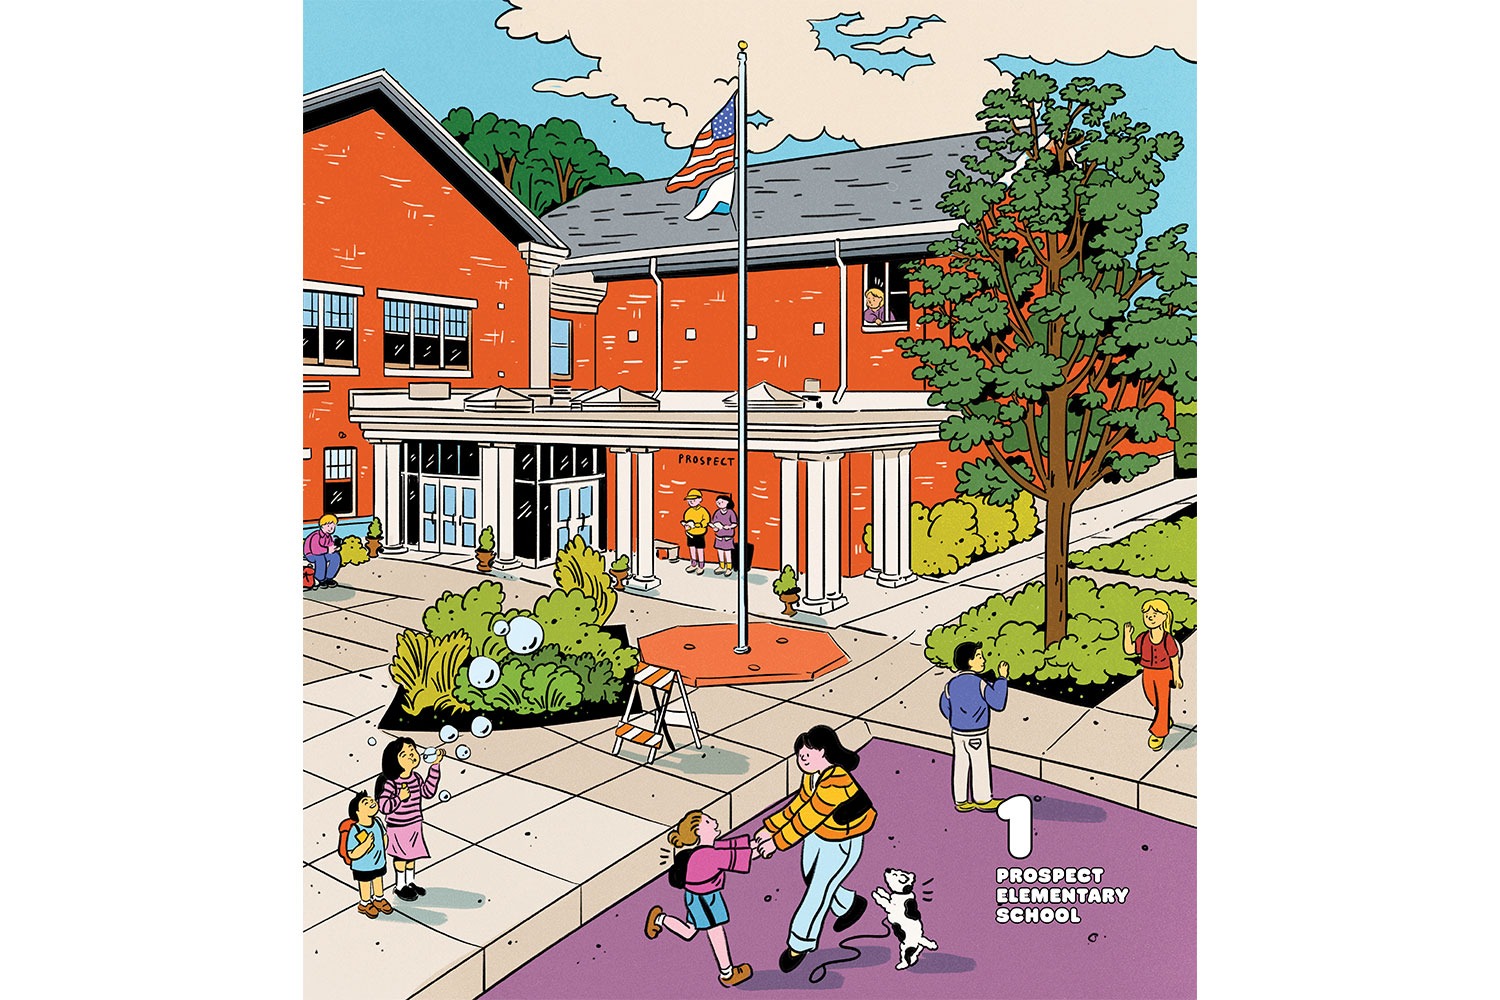
| 1 | Prospect Elementary School | Clarendon Hills |
Maintains its top spot from 2019.
K–5
| 311 | 82 | 78 | 3 |
| 2 | Westmont Junior High School | Westmont | 6–8 | 292 | 68 | 42 | 6 |
| 3 | Ellsworth Elementary School | Naperville | K–5 | 226 | 87 | 80 | 14 |
| 4 | Jefferson Elementary School | Elmhurst | K–5 | 343 | 78 | 72 | 5 |
| 5 | Oak Elementary School | Hinsdale | PK–5 | 390 | 89 | 92 | 7 |
| 6 | Madison School | Hinsdale | K–5 | 353 | 76 | 83 | 3 |
| 7 | Elm Elementary School | Burr Ridge | K–5 | 292 | 87 | 84 | 4 |
| 8 | Walker Elementary School | Clarendon Hills | K–5 | 297 | 80 | 80 | 4 |
| 9 | Monroe Elementary School | Hinsdale | K–5 | 301 | 82 | 79 | 4 |
| 10 | Norton Creek Elementary School | West Chicago | K–5 | 486 | 73 | 69 | 11 |
| 11 | John L. Sipley Elementary | Woodridge | PK–6 | 386 | 64 | 52 | 14 |
| 12 | J.T. Manning Elementary School | Westmont |
Has a Chicken Coop Club to teach students how to care for these animals.
2-5
| 385 | 55 | 61 | 11 |
| 13 | Hawthorne Elementary School | Elmhurst | K–5 | 571 | 71 | 64 | 4 |
| 14 | Concord Elementary School | Darien | PK–4 | 450 | 52 | 55 | 12 |
| 15 | Elmer H. Franzen Intermediate School | Itasca | 3–5 | 327 | 69 | 57 | 13 |
| 16 | Westfield Middle School | Bloomingdale | 6–8 | 494 | 89 | 57 | 17 |
| 17 | Brook Forest Elementary School | Oak Brook | K–5 | 279 | 72 | 72 | 13 |
| 18 | Edison Elementary School | Elmhurst | K–5 | 310 | 64 | 68 | 4 |
| 19 | Hadley Junior High School | Glen Ellyn |
The Second-biggest school in the county, despite serving only three grades.
6-8
| 1,104 | 80 | 62 | 17 |
| 20 | Meadow Glens Elementary School | Naperville | K–5 | 492 | 86 | 83 | 5 |
Best Lake County Elementaries and Junior Highs
| Grades | Enrollment | IAR English attainment % | IAR math attainment % | Chronic absenteeism % | |||
|---|---|---|---|---|---|---|---|
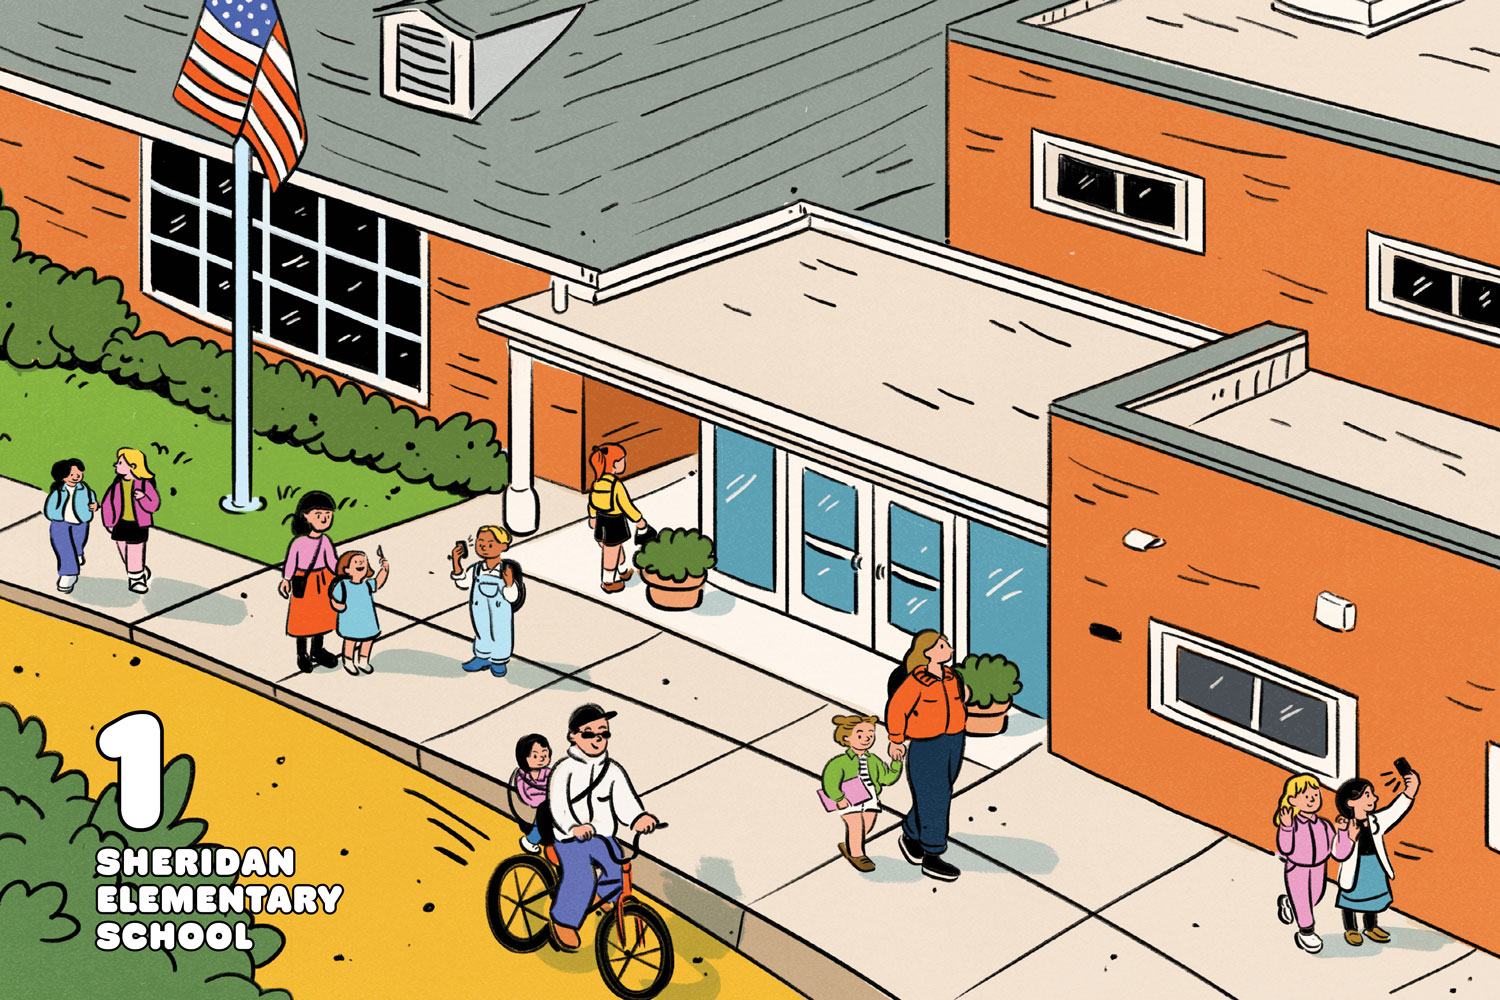
| 1 | Sheridan Elementary School | Lake Forest | PK–4 | 262 | 74 | 71 | 8 |
| 2 | Wayne Thomas Elementary School | Highland Park | K–5 | 433 | 73 | 66 | 11 |
| 3 | Prairie Elementary | Buffalo Grove | 1–5 | 449 | 73 | 71 | 10 |
| 4 | Bannockburn School | Bannockburn | K–8 | 169 | 80 | 66 | 15 |
| 5 | Everett Elementary School | Lake Forest | K–4 | 307 | 70 | 80 | 6 |
| 6 | North Barrington Elementary School | North Barrington | K–5 | 432 | 74 | 55 | 9 |
| 7 | Kildeer Countryside Elementary School | Long Grove | 1–5 | 452 | 62 | 69 | 11 |
| 8 | Butterfield School | Libertyville |
Powered by 75,000 square feet of solar panels on its roof.
PK–5
| 525 | 60 | 62 | 7 |
| 9 | Sherwood Elementary School | Highland Park | K–5 | 364 | 63 | 59 | 13 |
| 10 | Sarah Adams Elementary School | Lake Zurich | K–5 | 401 | 74 | 64 | 9 |
Best Kane County Elementaries and Junior Highs
| Grades | Enrollment | IAR English attainment % | IAR math attainment % | Chronic absenteeism % | |||
|---|---|---|---|---|---|---|---|
| 1 | Fabyan Elementary School | Geneva |
The highest-scoring school in the county for IAR math growth.
K–5
| 235 | 79 | 57 | 9 |
| 2 | Ferson Creek Elementary School | St. Charles | PK–5 | 580 | 74 | 71 | 14 |
| 3 | Bell-Graham Elementary School | St. Charles | K–5 | 472 | 74 | 67 | 15 |
| 4 | C.I. Johnson Elementary School | Aurora | 3–5 | 271 | 40 | 43 | 4 |
| 5 | Western Avenue Elementary School | Geneva | K–5 | 341 | 55 | 32 | 10 |
| 6 | Corron Elementary School | South Elgin | K–5 | 525 | 66 | 62 | 18 |
| 7 | Howard B. Thomas Grade School | Burlington | PK–5 | 639 | 54 | 34 | 11 |
| 8 | Thompson Middle School | St. Charles | 6–8 | 1,275 | 76 | 57 | 21 |
| 9 | Hoover-Wood Elementary School | Batavia | K–5 | 343 | 50 | 57 | 10 |
| 10 | Grace McWayne Elementary School | Batavia | K–5 | 348 | 46 | 59 | 6 |
Best McHenry County Elementaries and Junior Highs
| Grades | Enrollment | IAR English attainment % | IAR math attainment % | Chronic absenteeism % | |||
|---|---|---|---|---|---|---|---|
| 1 | Eastview Elementary School | Algonquin |
Up from No. 10 in 2019.
PK–5
| 422 | 65 | 60 | 13 |
| 2 | Creekside Middle School | Woodstock | 5–8 | 748 | 72 | 40 | 24 |
| 3 | Prairie Grove Elementary School | Crystal Lake | PK–4 | 528 | 54 | 52 | 16 |
| 4 | Neubert Elementary School | Algonquin | K–5 | 471 | 50 | 55 | 9 |
| 5 | Alden-Hebron Middle School | Hebron |
The smallest school in all six counties to make our rankings.
6-8
| 73 | 55 | 39 | 19 |
| 6 | Katherine Leggee Elementary School | Huntley | K–5 | 891 | 57 | 49 | 15 |
| 7 | Riley School | Marengo | K–8 | 240 | 56 | 49 | 11 |
| 8 | Nippersink Middle School | Richmond | 6–8 | 392 | 61 | 38 | 17 |
| 9 | Alden-Hebron Elementary School | Hebron | PK–5 | 232 | 55 | 26 | N/A |
| 10 | Conley Elementary School | Algonquin | 3–5 | 567 | 51 | 45 | 15 |
Best Will County Elementaries and Junior Highs
| Grades | Enrollment | IAR English attainment % | IAR math attainment % | Chronic absenteeism % | |||
|---|---|---|---|---|---|---|---|
| 1 | Homer Junior High School | Homer Glen | 7–8 | 795 | 79 | 56 | 15 |
| 2 | Oak Prairie Junior High School | Homer Glen | 6–8 | 451 | 82 | 36 | N/A |
| 3 | Kendall Elementary School | Naperville | K–5 | 582 | 68 | 69 | 9 |
| 4 | Graham Elementary School | Naperville | K–5 | 308 | 78 | 69 | 12 |
| 5 | Hickory Creek Middle School | Frankfort |
More students met or exceeded state English standards here than anywhere else in the suburbs.
6-8
| 945 | 92 | 74 | 12 |
| 6 | Gregory Middle School | Naperville | 6–8 | 823 | 80 | 66 | 9 |
| 7 | Shorewood Elementary School | Shorewood | K–4 | 326 | 44 | 53 | 10 |
| 8 | Jane Addams Middle School | Bolingbrook | 6–8 | 532 | 65 | 36 | 18 |
| 9 | Scullen Middle School | Naperville | 6–8 | 961 | 80 | 63 | 13 |
| 10 | Anna McDonald School | Manhattan | 2–3 | 585 | 57 | 47 | 12 |
How We Ranked the Schools
The performance measures were based on data obtained from the Illinois State Board of Education for the 2023–24 school year, the most recent available. Calculations were done by the research nonprofit RTI International, based on weighting instructions provided by Chicago. Not all the measures used appear in the rankings tables.
The Measures We Used
- IAR attainment is the percentage of students meeting or exceeding state standards on the Illinois Assessment of Readiness exams for ELA (English language arts) and math.
- IAR growth is the school’s average student growth percentile, which compares the year-over-year change by individual students on the IAR exams with that of comparable students in the state.
- Chronic absenteeism is the percentage of students who missed 10 percent or more of school days.
- 5Essentials is a teacher and student survey that assesses five key aspects of a school’s learning environment.
- Spending per pupil is the instructional expenditure, reported by the district.
How We Weighted the Measures
- IAR English attainment: 15%
- IAR English growth: 22.5%
- IAR math attainment: 15%
- IAR math growth: 22.5%
- Chronic absenteeism: 15%
- For Chicago schools
5Essentials: 10% - For suburban schools
Spending per pupil: 10%